At Emissary, a Software-as-a-Service provider focusing on SME, we wanted to empower our customers with a real time view on their engagement, analyze and manage their teams and predict opportunities.
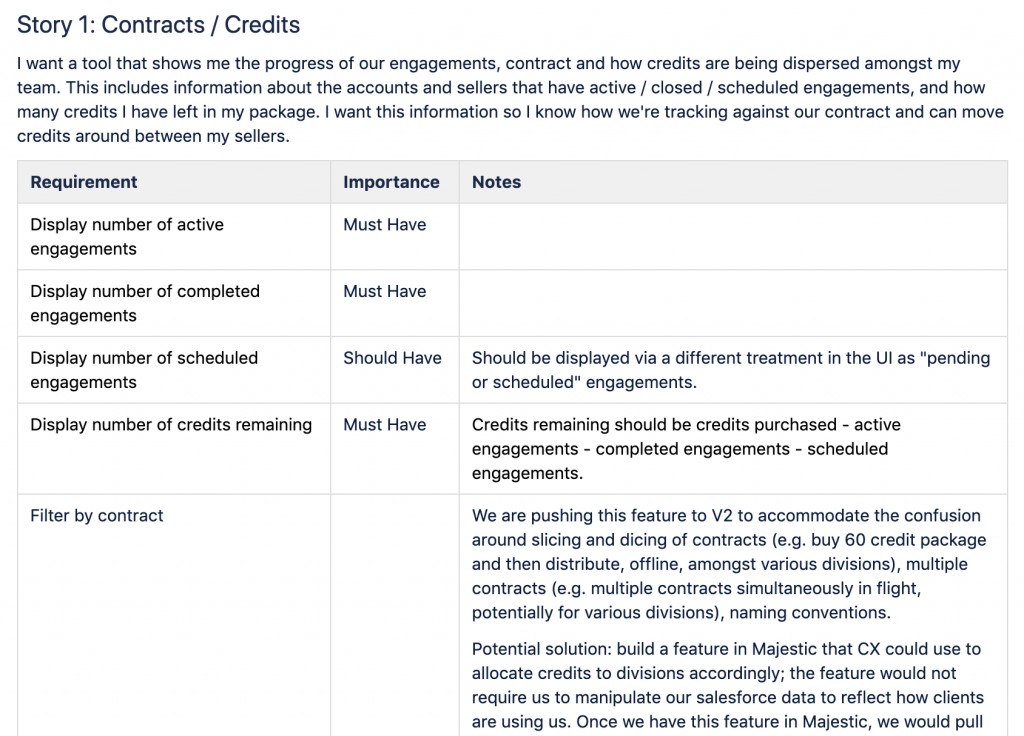
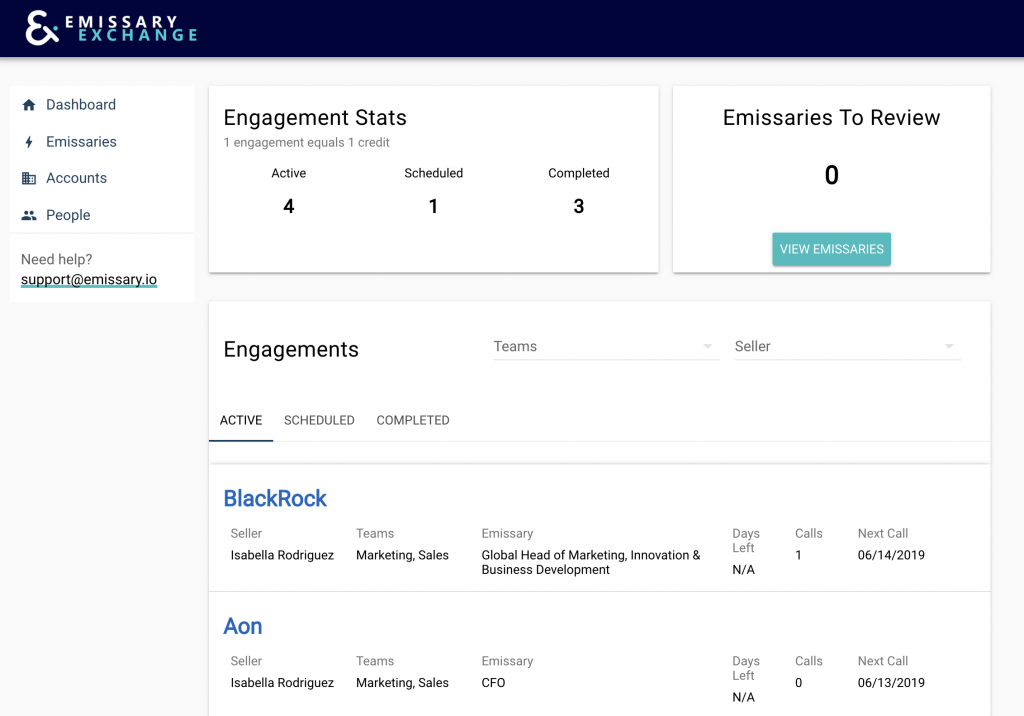
At the time, CX uses a client-specific spreadsheet to deliver information about engagements to clients. These trackers are manually updated Monday / Wednesday / Friday each week. It include details about active, closed, scheduled engagements, as well as links to transcripts, notes and call recordings.
Instead of this manual solution, we want to design and implement a productized version that clients can login and interact with.
My Role
I led the user research and design of the dashboard experience. I partnered with 2 product managers, an engineer, and a data analyst.
Research
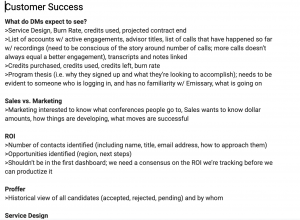
My product manager and myself interviewed Customer Success, Sales and Engagements Ops to understand their assumptions and expectations:
- What do you assume customers want to see?
- What do you need customers to see?
This started us to give us some guidance around what to expect.
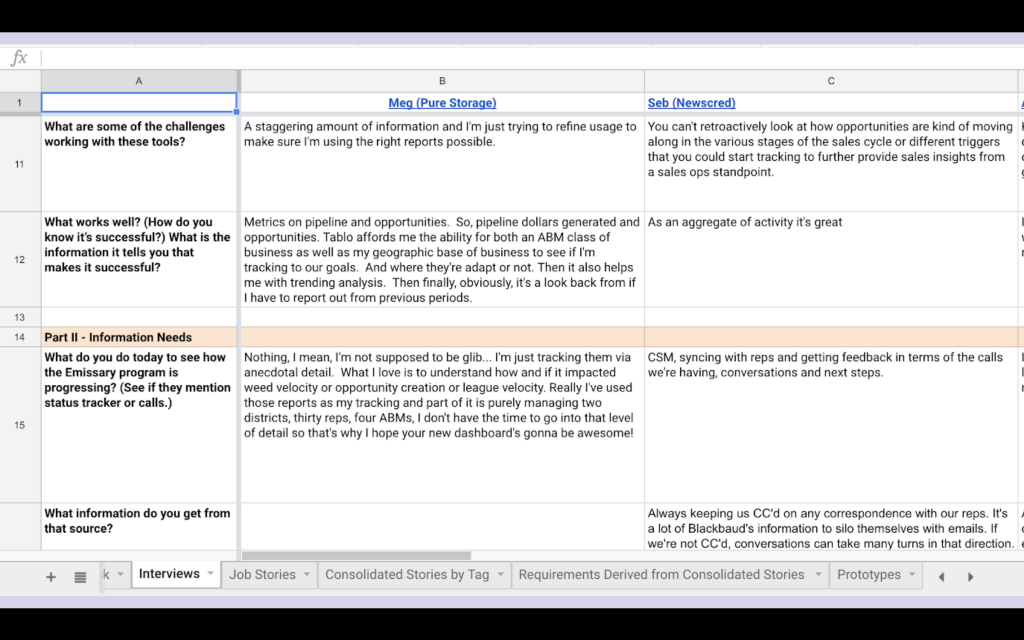
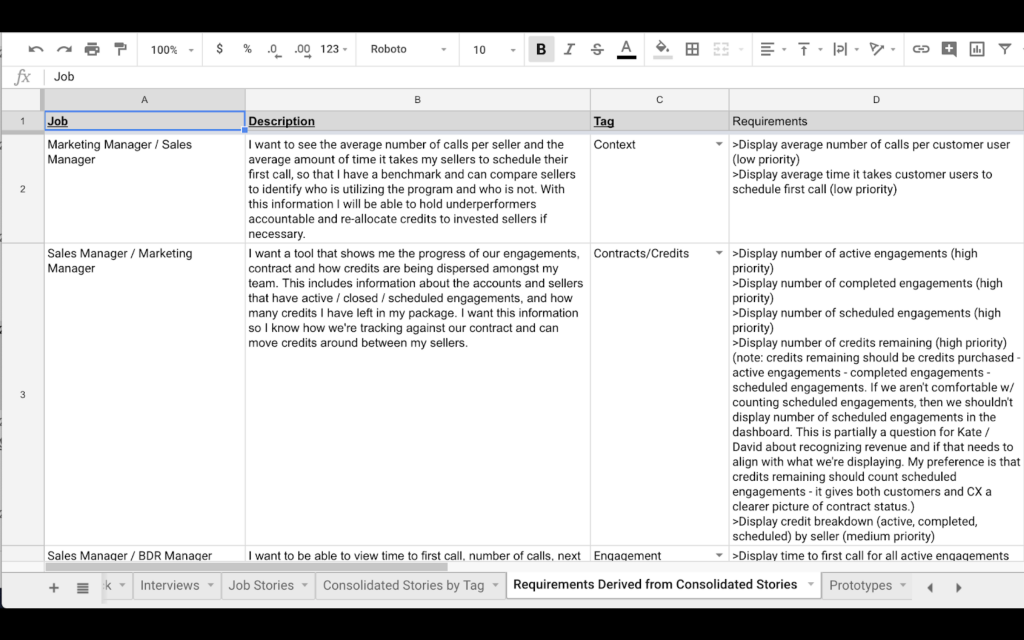
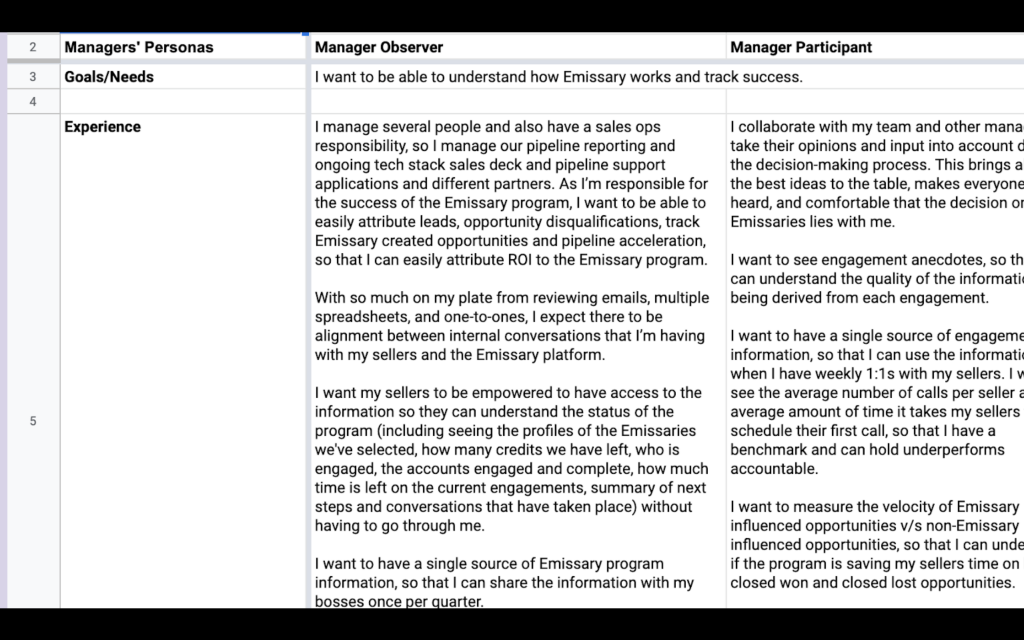
We then interviewed specific cohorts of managers to understand what was working and what wasn’t. After compiling the information in a spreadsheet, we used the information to create personas, requirements, and job stories to understand what needs they want met.
With all the data we’ve collected, we were ready to start shaping a dashboard experience for managers.
What does a dashboard mean to us?
First, everyone needed to have a shared understanding of the dashboard and what it represents. It is the most important component of the product and the element we strive to improve every day. I workshopped with the Design Director and a product manager to define 3 main must-have purposes of a dashboard:
- Single point of access for disparate data
Instead of opening various applications, interfaces, or online databases, the user needs only to open the dashboard. A dashboard is internally linked to multiple relevant data sources and continues to update of any change in real time. - Broad overview with drill down capabilities
A dashboard is a dynamic collection of charts, text, and graphical elements — and this combination is both vertical as well as horizontal. Charts are stacked on top of another, allowing users to zero-in on a specific data point and further inspect it for deeper insights. - Easier, faster, comprehensive data
An information dashboard takes the best of several worlds — numbers, charts, text segments, colors, and images — and places them intelligently for quick consumption and lasting impressions. A dashboard takes readable numbers and transforms them into viewable images.
What are dashboard design best practices?
After understanding the generic purpose, I further needed to define generic design principles that could then be applied to all future dashboards without being too restrictive:
- Provide relevant info quickly
The dashboard should be able to answer the most frequently asked business questions at a glance. - Display information in a logical layout
Display the most significant insights on the top, trends in the middle, and granular details in the bottom. - Use the right data visualization
Select the appropriate type of data visualization according to which type of info you are trying to rely
What are we tracking and for whom?
I outlined the goals of the experience so there’s an understanding of what we’re aiming for:
- Give Program Owners (managers) a tool to manage their sellers as they use the Emissary program.
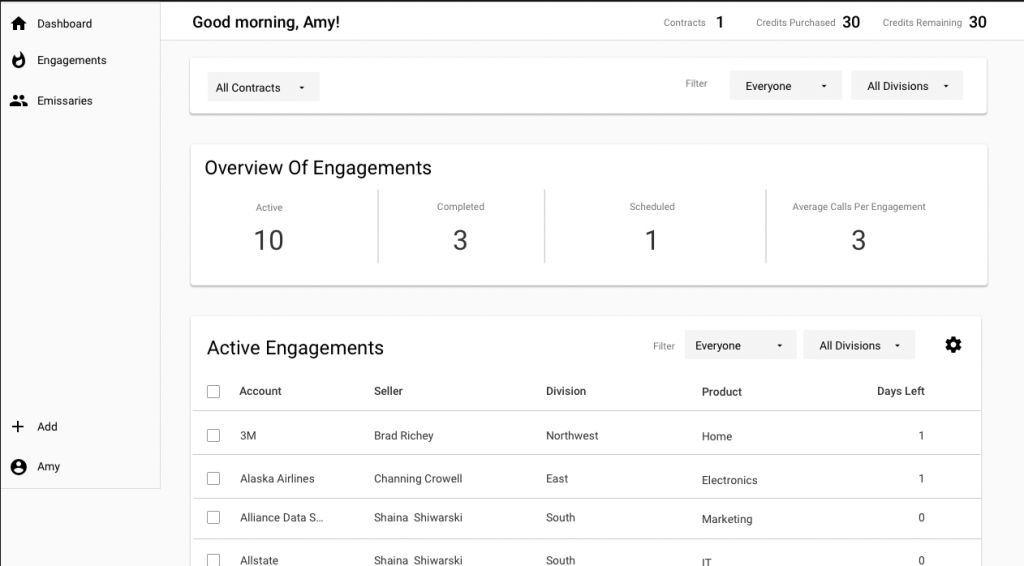
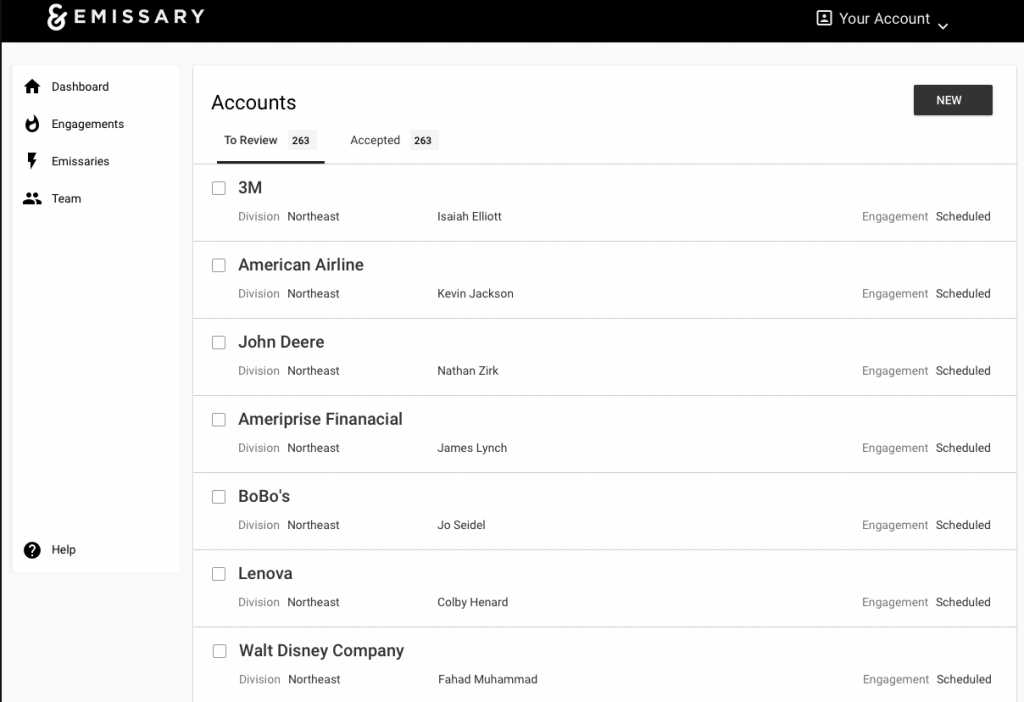
- Create a central place for Program Owners to see the status of the program and details of active, closed, and scheduled engagements
- Eliminate the need for CX to have non-strategic, off-product interactions with Program Owners
- Give demand a tool to help elevate the program and better position themselves for sales and upsells.
Along with the goal, we need to track this to determine the measure of success which was measure through number of managers that were logging in to use it and active usage of the platform.
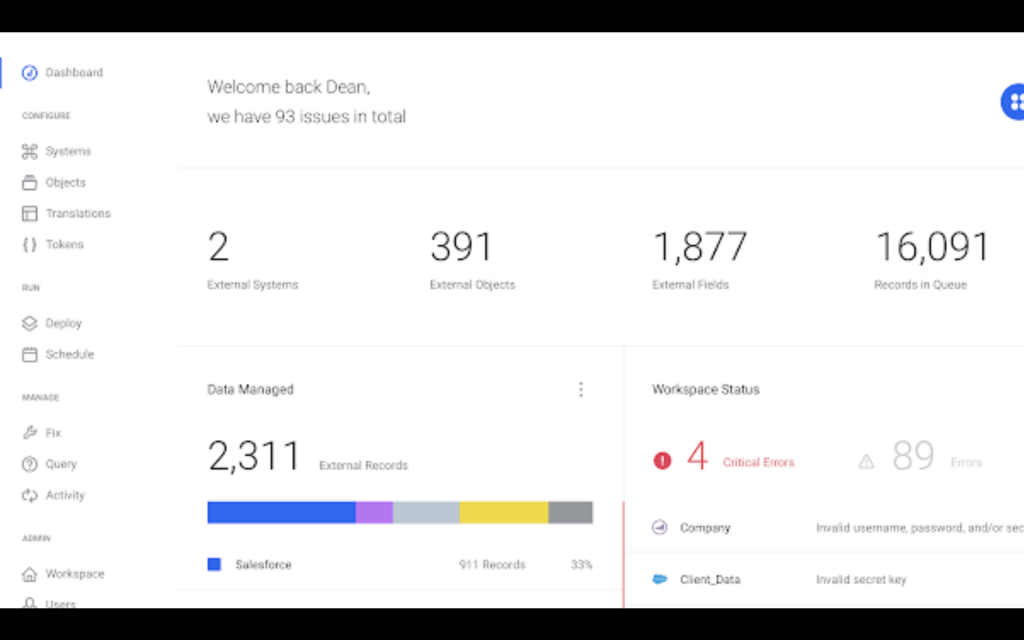
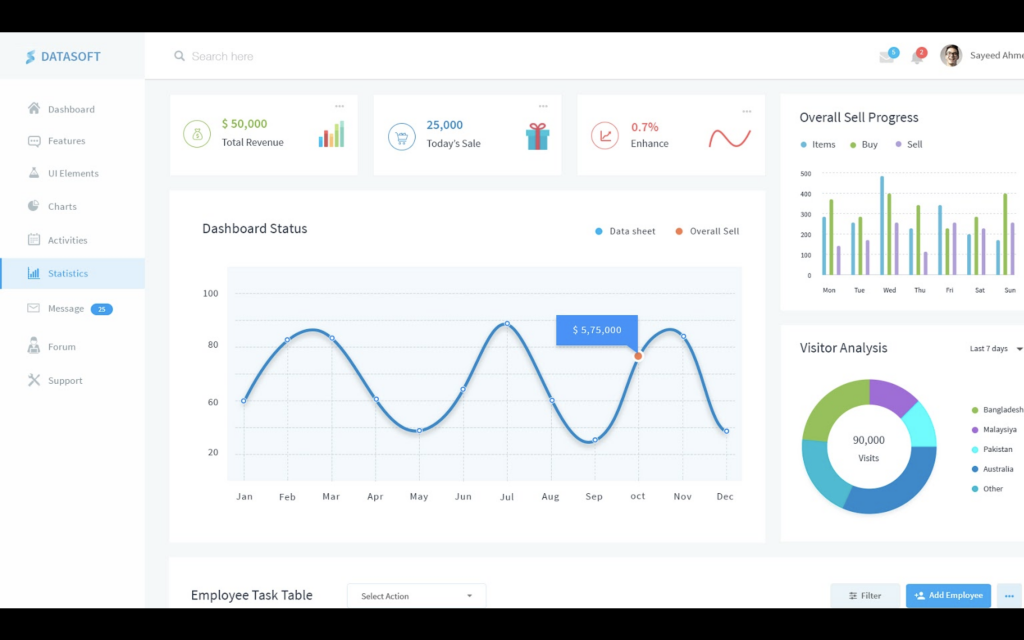
Competitive Analysis
There are many dashboards out there. How do other companies solve in distilling complex information into digestible content? I use these examples to discuss my thoughts with colleagues and describe some of the visual ideas, before I start with the pixel process.
Sketches to Prototype
From the requirements, I led workshop sessions with a few internal members to get them excited and to help conceptualize what a dashboard could look like.
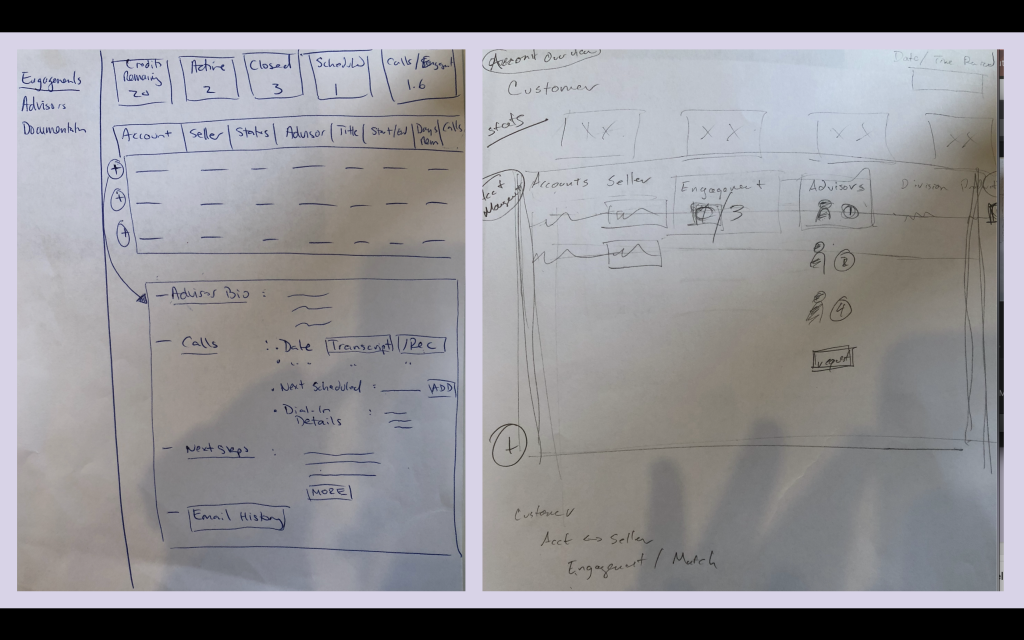
User flows were instrumental in understanding where the different information lives.
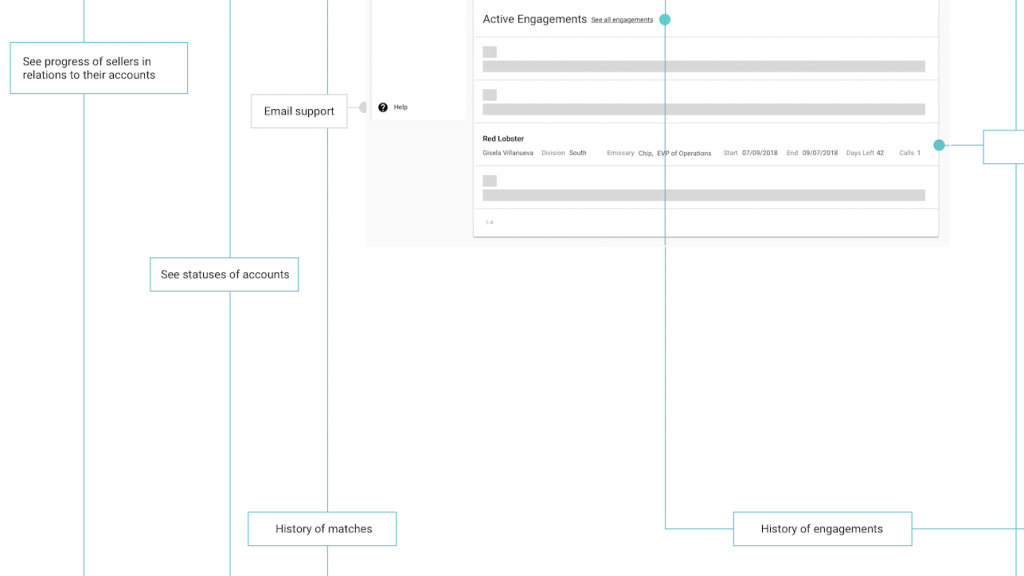
After understanding where the information lives, I put all the content on the page and review the information hierarchy. It’s much easier to design and play with the concept with the content in place.
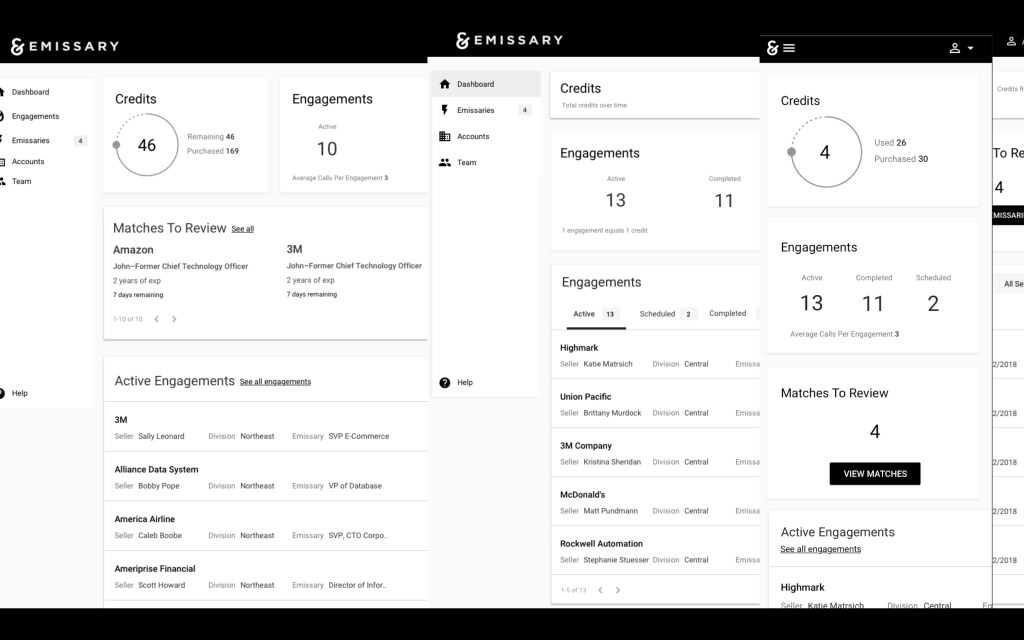
Once an initial design was in wireframe stage, I prototyped it in InVision to present to the engineering team to understand the technical limitations. One of the key things is to always have all interaction ready in prototype. It’s great to add comments to parts of the designs to expand the specification much more so that even engineers can easily comment on feasibility. Then, I prototyped it for different managers along with related questions for their feedback, and finally the internal teams.
Production
I worked with the engineer in creating a standard for design quality assurance and flows despite the technical limitations of two conflicting development platforms.
Feedback
“This is my workflow and I can see everything my sellers are doing with the program. I can have informed 1:1s with my sellers to help identify what’s missing from their strategies or give support if needed to help them with their accounts.”